What if you could know, at a glance, exactly where your sales process breaks—and how to fix it? – Sales KPI Scorecard
Too many SMEs track sales performance with scattered spreadsheets, occasional check-ins, or just gut feeling. But without the right metrics, you can’t improve what matters.
That’s where a Sales KPI Scorecard comes in. It gives you a live pulse on your pipeline, reps, and results—so you can coach smarter, adjust faster, and grow with confidence.
📊 Why Sales KPIs Matter for SMEs
Your CRM is full of data—but are you using it to make better decisions?
With a structured scorecard:
✅ You spot stalled deals before they disappear
✅ You track sales team activity and effectiveness
✅ You can forecast revenue with real numbers
✅ You coach based on facts, not feelings
Without it, sales becomes a guessing game.
📈 Which Sales Metrics Should You Track?
Here are essential KPIs every SME should include in their sales dashboard:
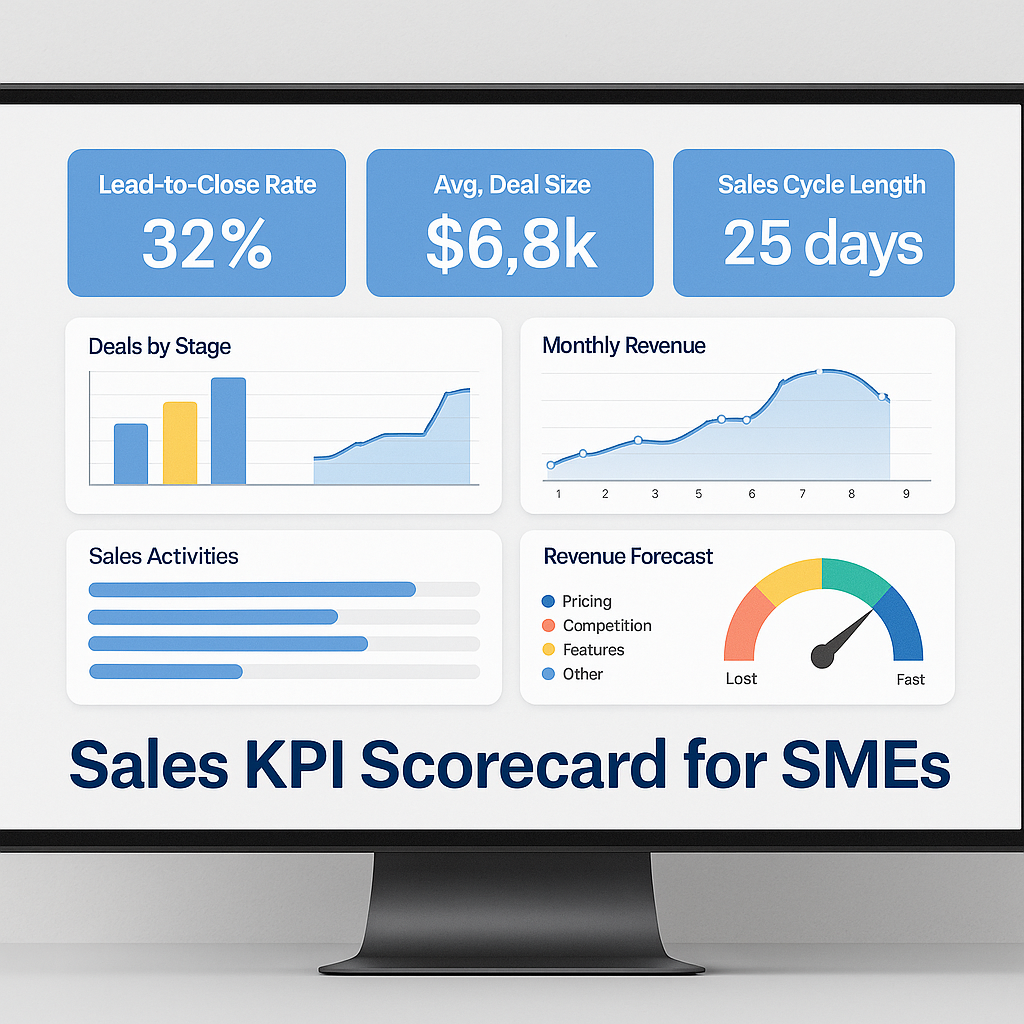
- Lead-to-Close Rate
- Average Deal Size
- Sales Cycle Length (time to close)
- Follow-Up Response Rate
- Deals by Stage (pipeline distribution)
- Sales Activities (calls, meetings, proposals sent)
- Forecasted vs Actual Revenue
Each one reveals a story—and together, they show you where to focus next.
🔧 How to Build a Sales KPI Scorecard (Without the Manual Work)
Use automation tools like Zapier, Make, or N8N to pull data from your CRM into a dynamic scorecard.
You can build it with:
And connect to CRMs like:
GoHighlevel, HubSpot, Vtiger, Zoho CRM
🔄 Real-World Example: From CRM to Actionable Dashboard
Let’s say your sales team uses HubSpot CRM.
- New leads come in from forms or landing pages
- Activity logs track calls, emails, and tasks
- Zapier pushes all data into a Google Sheet
- That sheet auto-updates a Power BI dashboard every 4 hours
- You now have a live view of rep activity, deal flow, and forecast
This dashboard is visible to managers and reps—making it a shared tool for coaching and accountability.
🧩 Add Visual Insights for Better Decisions
Use visual widgets like:
📊 Bar chart for deals per rep
📈 Line chart for monthly revenue trend
🎯 Gauge chart for target vs actual
📍 Pie chart for lost reasons by category
These visuals turn numbers into clarity—and clarity drives action.
✅ Conclusion: Don’t Just Report—React
A Sales KPI Scorecard is more than a report—it’s your daily guide to smarter growth.
When everyone sees the same numbers, works toward the same goals, and knows what to do next—you win more often.
👉 Want a custom KPI dashboard for your sales team?
We’ll help you build it—automated, visual, and ready to scale.